When training jobs die and the GPU logs don't explain it
Multi-day GPU training jobs sometimes collapse without a useful error in the logs. Most of the time the failure started in the electrical domain, not in the GPUs themselves, at timescales the observability stack never sampled.
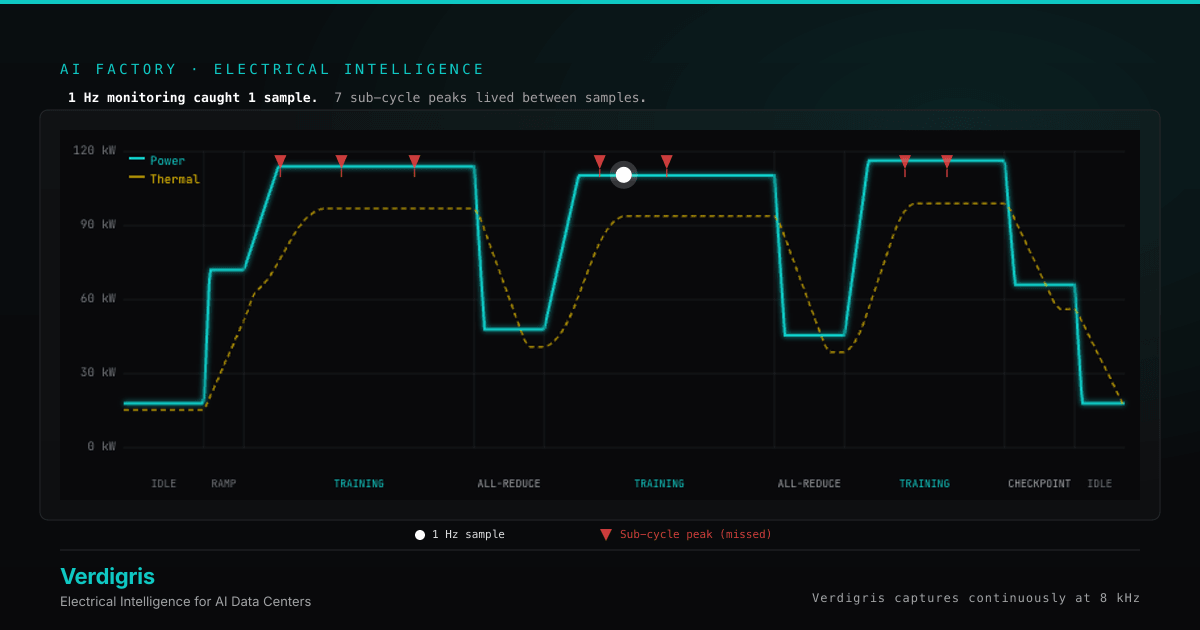
8 kHz
Sampling rate that resolves sub-cycle electrical events
1 Hz
What standard observability stacks actually capture
Between samples
Where the failure mode lives
A growing share of unexplained GPU training failures are sub-cycle electrical events the observability stack never sampled. The signal is there, just at timescales that 1 Hz monitoring cannot resolve.
If you run large-scale GPU training, you've probably seen this one. A multi-day job dies partway through, the GPU logs show nothing obvious, the cluster comes back up fine, and nobody can explain what happened. The node that dropped passed every health check before and after. You file it under "weird" and move on.
A growing share of those incidents are power events. Not the kind you'd notice. Not outages. Sub-cycle transients, harmonic distortion, UPS behavior that's drifted outside its tested envelope. The kind of thing that lives in the electrical domain at timescales your observability stack was never built to sample. So the data never makes it in, and the post-mortem comes up empty.
I've been spending time with operators running into this, and the pattern is consistent enough that I think it's worth writing up. The failure mode has a name and a shape, even if nobody in your org is looking for it yet.
Here's what's actually going on underneath.
Data center power distribution was designed around server loads, which are basically steady and predictable. GPU training is neither. During synchronized training, a rack cycles between compute and communication phases (full draw, then partial, then full again, on the order of milliseconds). NVIDIA, Microsoft, and OpenAI have all published on this. Rack-level swings from around 30% to 100% and back, repeated for the life of the job. If you've ever looked at a tail latency graph where the p50 looks flat and the p99 is a mess, it's the same shape. The average smooths away the thing that's actually hurting you.
The events that fail training jobs are spiky in time AND have spectral content above your sample rate. Both legs of the argument — visible together.
On top of that, GPU power supplies are switched-mode, which means they draw current in pulses instead of smooth sine waves. That injects harmonic content onto a distribution system that was sized and tested for a much cleaner waveform. Harmonics cause heating, and heating is what ages power equipment. None of this is exotic. It's been the reality in AI-dense facilities for a couple of years. It's not in most people's mental model of "power," which tends to default to "did the breaker trip."
What the failures actually look like
Three patterns show up repeatedly when operators bring me their post-mortems.
Pattern 1
Peak headroom that never existed
Pattern 2
UPS drift outside tested envelope
Pattern 3
Transformer thermal drift under harmonic load
The first: a PDU that reads 78% utilization at one-second resolution is sometimes hitting 95%+ for tens of milliseconds during synchronized phases. If the protection trips, the node drops and the post-mortem shows a healthy node on a circuit with plenty of headroom, because the headroom calculation was based on averaged data that smoothed out the peaks.
The second: UPS drift. UPS units get rated and tested against specific harmonic profiles; put a load on them with different harmonic content and the rectifiers and capacitors operate in conditions they weren't characterized for. The failures don't happen immediately, they creep in over months, and the node-level symptom is usually a brief power disturbance that your GPU logs can't diagnose.
The third: transformer thermal drift. Harmonic currents cause extra heating through eddy-current losses and skin effect, and transformers that ran cool for years under server loads start trending warmer. The facility BMS shows that temperature, but your cluster telemetry doesn't, and the correlation between "that transformer's temperature" and "which nodes fail" isn't in anyone's runbook.
The common thread is that the signal exists in the electrical domain, at timescales your observability stack doesn't sample.
The sampling gap
Which gets to the awkward part. Your current stack (Prometheus, Datadog, whatever) can scrape at 1 Hz, maybe 10 Hz on hot paths. The facility BMS is usually slower, polling at 1 Hz or logging 15-minute intervals for utility billing. None of that is built for sub-cycle electrical phenomena.
The data that matters lives at kilohertz frequencies. You'd need to sample at 8 kHz or higher, continuous, to resolve the harmonic content that actually stresses equipment. That's about four orders of magnitude more data than your metrics pipeline is designed to handle, so you can't solve it by cranking up the scrape interval. The raw waveforms have to come from purpose-built hardware in the power path, and what flows into your observability stack is derived metrics and events, not waveforms. Harmonic distortion above threshold. Transient peaks on specific circuits. UPS waveform drift from baseline. The alertable form of the signature, basically.
Facilities, SRE, and the runbook gap
And then there's the org question, which is the one I keep hearing most. In most shops, power is Facilities' problem and cluster health is SRE's problem. These failure modes cross the boundary: the signal lives in power, the symptom lands in your logs. So who gets paged when a training job dies and the electrical signature looks anomalous? Usually nobody, because nobody's looking at the electrical signature.
Does your facility team share sub-cycle power data with platform, or only billing-interval summaries? Almost always only the summaries. It's not hostility; the data sources were never set up to talk to each other.
A mystery is fine once. Three times in a quarter on $10M of GPU time is a conversation.
There's no clean org-chart answer to this one. But the practical version is that SRE has to get visibility into the same electrical signal Facilities has, at the timescale events actually happen. Otherwise you're troubleshooting a failure domain you literally can't see.
The cost of the sampling gap
When a training job dies on a circuit that "had headroom," the cost shows up in three places: lost compute time on the dropped run (often days of GPU-hours), checkpoint rollback overhead, and SLA exposure to whoever's paying for the cluster. On a 10 MW GPU buildout, those events compound fast.
What to push on if you're retrofitting
If you're retrofitting an existing facility for GPU density, or running jobs in one that was, the concrete actions worth pushing on are pretty specific.
- Baseline the existing electrical environment before the load changes (harmonic signatures, UPS behavior, transformer thermals under today's load). Without that you can't tell the difference between a GPU-induced drift and something that was always there.
- Get sub-cycle monitoring on the circuits that matter, with derived metrics flowing into whatever observability stack your platform team already runs. The goal isn't to replace your monitoring, it's to close the sampling gap for this one specific failure domain.
- Build a shared runbook with Facilities for power-adjacent incidents, because even if the tooling gap closes, the org gap won't close on its own.
Key takeaways
This is more or less what Verdigris built EV2 for. The hardware captures at 8 kHz continuous on individual circuits, and the derived signals are designed to feed the observability stack you're already running. If that's the gap you're feeling, it's worth a conversation. But honestly, even if you don't end up buying anything, it's worth knowing the gap has a name and a shape.